
3 min read
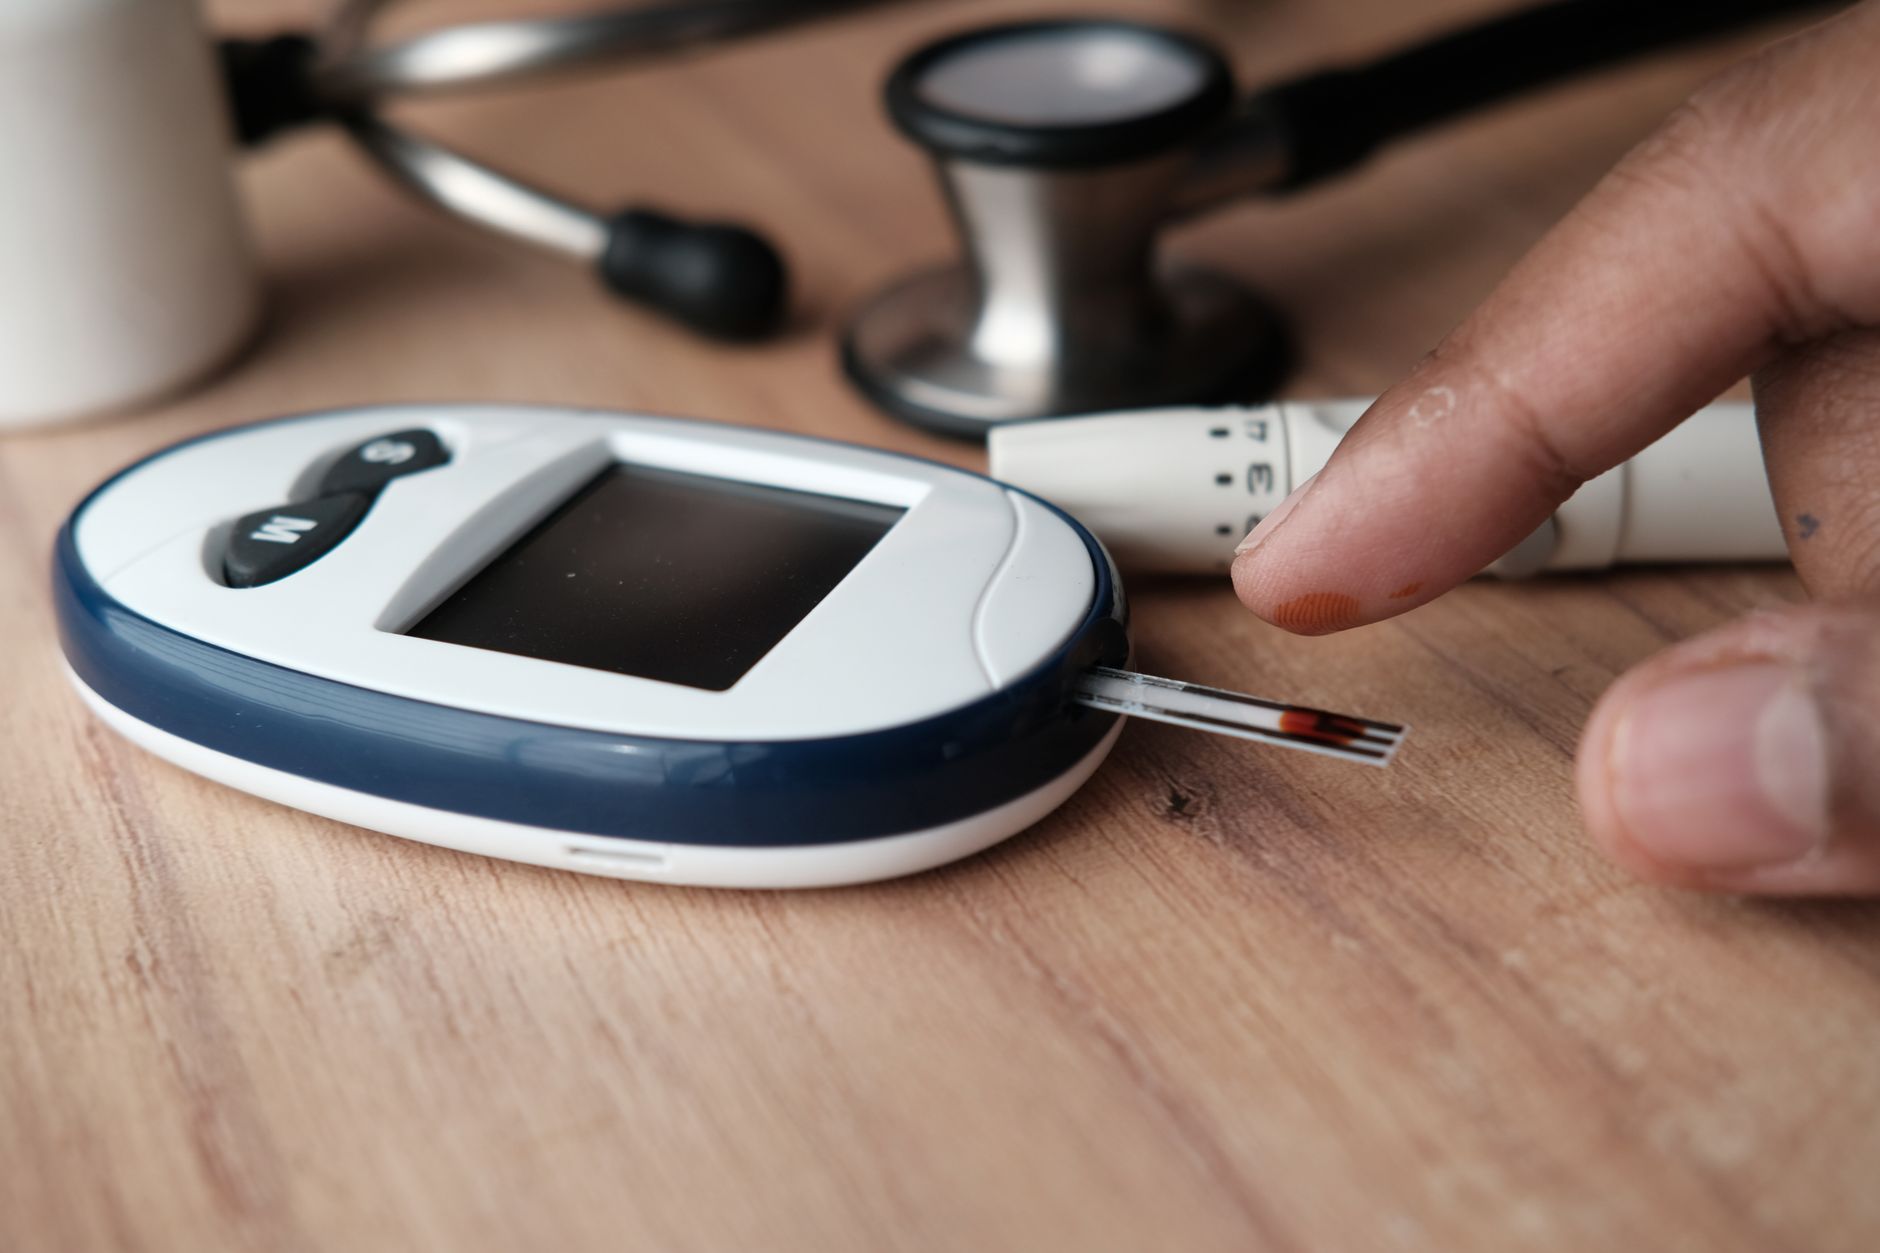
Wearing a continuous glucose monitor without knowing how to interpret the data is a little like getting a detailed lab panel with no reference ranges — interesting, but not yet useful.
I see this often. Someone starts wearing a CGM, watches the numbers move up and down after meals, and walks away more confused than when they started. The tool is powerful. The missing piece is context.
A CGM is not just a diabetes management device. For people without diabetes, it is one of the most informative windows we have into how your metabolism is actually functioning in real life — not just at a single fasting measurement on a random Tuesday morning. It captures what your standard labs never will: the full story of how your body responds to food, stress, sleep, and movement over time.
Here is what I tell my clients to pay attention to.
The first pattern worth understanding is your post-meal response. After eating, it is normal for blood sugar to rise and then return to baseline within about two hours. What is not ideal is a sharp spike — typically above 140 mg/dL — followed by a rapid drop. That drop is often what drives cravings, fatigue, and the feeling that you need something sweet an hour after you ate a full meal. The spike is not the only problem. The crash is where a lot of symptoms live.
The second pattern is your overnight baseline. A healthy fasting glucose typically sits between 70 and 90 mg/dL. If your CGM shows you waking up consistently in the mid-90s or higher, or if you see a rise in glucose in the early morning hours before you have eaten anything, that is a signal worth investigating. This pattern — sometimes called the dawn phenomenon — often reflects cortisol and insulin dynamics that do not show up anywhere else.
The third pattern is variability across the day. Smooth, gradual curves are a sign of stability. Frequent large swings are a sign that your metabolic system is working harder than it should. Over time, that variability has downstream effects on your hormones, your inflammation levels, your energy, and your sleep.
None of this requires a clinical background to observe. What it requires is knowing what you are looking at. The data your CGM collects is genuinely useful — it just needs to be interpreted through the right framework.
If you want to go deeper with your CGM experience, I run a course for individuals and corporate groups designed to help you understand exactly what your data means and what to do with it. It is practical, root-cause focused, and built for people who are serious about understanding their metabolic health, not just watching numbers move.
Your body is not random. The patterns are there. The goal is learning how to read them.
If you’re curious whether a CGM could clarify your own patterns, our free Blood Sugar Balance Assessment is a good place to start.
Ready to feel better?
If you’re tired of feeling stuck, defined by your disease, and ready to address the factors fueling illness and chronic symptoms, let’s get started today.
Schedule a complimentary strategy session
Dustin Barrington
Founder, Peak Functional Health — Functional Nutrition Counselor, CFNC